There is a graph that often gets posted around the internet that shows how your money compounds at a 7% rate of return. One of the things that often gets pointed out is that it takes less time to go from $600k to $1 million than it takes to go from zero to $100k due to the effects of compounding (the original post is at Four Pillar Freedom). While that is true mathematically, that isn’t true in practice.
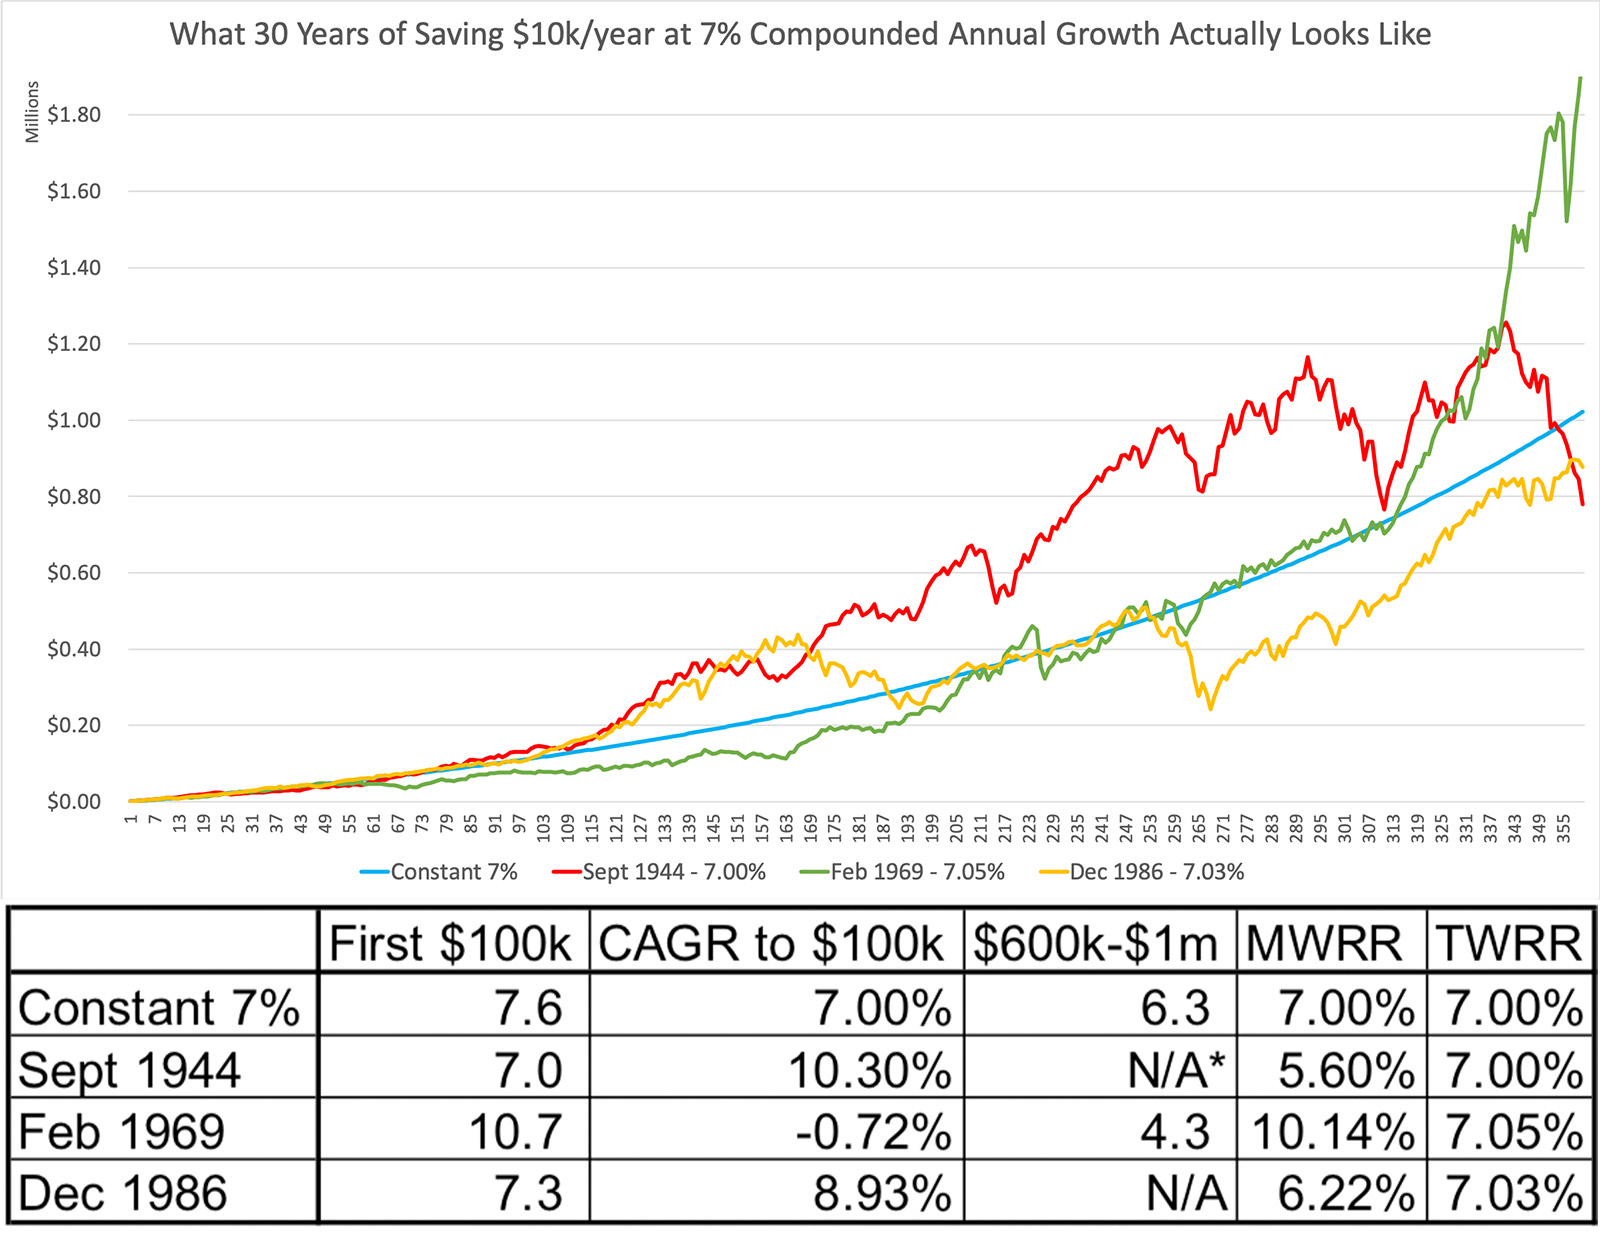
I went through and looked at 30-year periods of S&P 500 returns that had a real (inflation-adjusted) 30-year compounded annual growth rate of very close to 7% (they were basically chosen at random). Then, I simulated what kind of returns an investor would have received if they saved $10k a year ($833.33 a month) for 30 years.
The results were quite surprising. Each of the periods had a time-weighted return (compounded annual return, geometric return, or TWRR) of almost exactly 7%. However, the money-weighted (or dollar-weighted) rate of return (MWRR) varied from 5.6% to 10.14%.
Why? Because the sequence of returns matters.
In fact, the time period with the best 30-year return had the worst initial 10-year return, and the time periods with the best initial 10-year returns had the worst 30-year returns.
September 1944-1974 - The post-war boom yielded the fastest time to $100k, at only 7 years, which equates to a 10.3% compound rate of return. An investor would think they were sitting pretty and that this investing thing is really easy. Returns were pretty strong for nearly 23 years, when the investor first hit $1 million. However, volatility started to rear its head and by year 30, the portfolio had fallen in value to $780k, even including the continued $10k a year contributions.
December 1986-2016 - This investor also started strong and built quickly through the 1990s tech boom, taking only 7.3 years to reach $100k at a 8.93% compound rate of return. However, low returns in the early 2000s followed by the crash in 2007-2009 put a damper on returns moving forward, and the investor never reached $1 million in the 30-year period.
February 1969-1999 - This would have been very tough for the investor. It took nearly 11 years to reach the first $100k, during which time the investor earned a -0.72% compound rate of return. Yes, for those eleven years, the investor would have lost money. Could that investor have stuck with the plan and continued investing in the market when safe bonds and savings accounts were paying more? Maybe, maybe not. However, if they did stick with the plan, they were eventually rewarded. The 1990s tech boom juiced returns and by the end of the 30-year period the investor had a portfolio of nearly $2 million at a 10.14% compound rate of return.
Conclusions
This was a case study in three random time periods, so it shouldn’t be taken as gospel that good returns early mean bad later returns and vice versa. Markets are volatile, and it can be difficult to stick with the plan. However, over any 30-year period there will be over-performance and there will be under-performance. To be rewarded during the periods of over-performance one must stick with the plan and keep investing during periods of under-performance.
This also goes to show that simply looking at the compounded annual return for an index or a mutual fund over a period of time can be very misleading. The sequence of the returns matters for investors, and dollars invested earlier carry more weight in the portfolio than dollars invested later. The dollar-weighted weight of return can vary widely for identical time-weighted rates of return.
Real S&P 500 return data was taken from https://earlyretirementnow.com/2018/08/29/google-sheet-updates-swr-series-part-28/
Also, I like Four Pillar Freedom, so this is not a dig at that site. The site has much more nuanced articles that deal some with this topic, but I often see the constant 7% compounded return graph posted and wanted to provide some context.