TLDR: We should optimize FIRE accumulation investment portfolios for withdrawal rates and volatility, not maximizing long-term compounded growth. This means a 100% equity portfolio is not the optimal asset allocation to achieve FI. We should get to the portfolio asset allocation we want during the withdrawal phase (retirement) much sooner than conventional wisdom states, perhaps from day 1.
I had an epiphany over the weekend, and I’d like to hear what people think: All else being equal, our primary goal is to shorten the time to FI. The goal is not to get rich; the goal is to get enough as quickly as reasonably possible. I have heard over and over again that time-to-FI is a function of your savings rate, but that is untrue. Time-to-FI is a function of three things:
- Savings rate
- Portfolio safe withdrawal rate
- Portfolio volatility
1. SAVINGS RATE
We know this. The more you save, the faster you reach FI.
2. PORTFOLIO SAFE WITHDRAWAL RATES
Different portfolio asset allocations can sustain different withdrawal rates. If we can increase the safe withdrawal rate of a portfolio, we can shorten the time-to-FI. For example, assuming you need to withdraw $40k a year, your portfolio needs the following balances at different withdrawal rates:
- 3% - $1,333,333
- 4% - $1,000,000
- 5% - $ 800,000
- 6% - $ 666,667
If, for example, you could move from a 3% withdrawal rate to a 5% withdrawal rate, you would need a 40% smaller portfolio, thus shortening the time-to-FI.
3. PORTFOLIO VOLATILITY
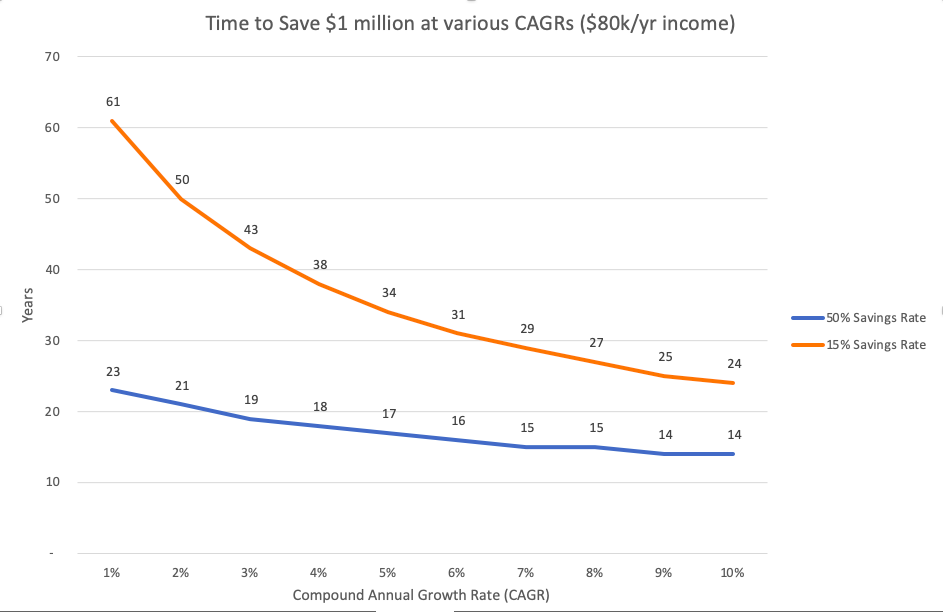
This is the part that I really thought about this weekend. At high savings rates, portfolio returns are almost irrelevant during the accumulation phase (see photo, above). If you are saving 50% of your income or more, a low rate-of-return will not meaningfully shorten your time-to-FI. Almost all investing writing in the world assumes that there is a 40-year investing horizon (or longer). For the average person this is correct, but this is not correct for someone pursuing FI through a high savings rate. The time difference between earning 2% and 5% when you are saving 50% of your income is four years (the difference between retiring at 54 or 58).
However, the difference between that same rate-of-return when you are only saving 15% of your income is sixteen years (that’s the difference between retiring at 54 or 70). The entire financial services industry and most investment advice is written for this much longer investing time horizon.
The real risk for someone with a high savings rate is overly risking your portfolio unnecessarily with a volatile asset allocation, which runs the risk of lengthening your time-to-FI. How many years does it take to save $1 million? Since 1970, saving $40k a year it has taken you this long:
- Stocks/Bonds: Min time-Max time (years)
- 100/0: 10-19
- 80/20: 11-18
- 60/40: 12-18
- 40/60: 13-17
- 20/80: 14-18
So, a 100% equity portfolio has had both the shortest and longest time to reach $1 million. Conventional wisdom seems to assume that 100% equities will give us the shortest time-to-FI. It might, but it might also give us the longest time to FI. Especially given the 10-year bull run we are on, I think we are more likely to be towards the long end of the spectrum than the short end (though I think the lesson here is not to time the market but to realize that the time-to-FI window is extremely large with a 100% equity portfolio). If you want to narrow your time-to-FI window, you need a more conservative portfolio than 100% equities.
4. COMBINING WITHDRAWAL RATES WITH VOLATILITY
This is where the magic happens. What if we combine low volatility and high withdrawal rates? Often times, lower volatility portfolios can sustain higher withdrawal rates due to mitigating sequence of returns risk. This means that more volatile portfolios require higher portfolio balances to generate the same amount of income. Assuming a 50% savings rate, how long does it take to reach a 40-year safe withdrawal rate for a given portfolio?
- Stocks/Bonds: Min time-Max time (years)
- 100/0: 10-20
- 80/20: 11-19
- 60/40: 12-18
- 40/60: 13-18
- AAA 1: 11-16
- AAA 2: 11-13
- AAA 3: 11-16
Above, I include three Alternative Asset Allocations (AAA 1-3). I don’t want to post the exact asset allocations in case someone sees it and wants to copy it without understanding the underlying allocations. However, each of the three allocations is very unorthodox and contains much higher levels of bonds and alternatives (REITs, commodities, gold) than is often recommended in the FI community. By thinking a little bit outside the box when it comes to asset allocation, we can keep the best-case scenarios alive (11 years to FI), while guarding against downside risk.
What matters is not just average return, but portfolio volatility. It doesn’t matter if the average equity portfolio returns 7.8%. We don’t own the average portfolio, we only own our actual portfolio. The question is: are we more likely to return a -3.3% return over 10 years or a +14.8% return? (those are the minimum and maximum real equity returns over 10 years since 1970) Given a random point in time, you could say both are equally likely, though in today’s environment I would say we are more likely to be closer to the -3.3% than the +14.8%. If you are within five years of FI, the spread is even wider: real 5-year returns for a 100% equity portfolio range from -9.4% to +24.4%.
Below are some stats on various portfolio allocations since 1970:
- Stock/Bonds: Min, Median, Max CAGR (10-yr); drawdown* max, drawdown length (yrs) [40-year safe withdrawal rate]
- 100/0: -3.3%, 7.8%, 14.8%; 49%, 13 [4.1%]
- 88/12 (Stocks/Cash): -2.6%, 7.3%, 13.4%; 44%, 12 [4.4%]
- 80/20: -1.4%, 6.7%, 13.1%; 42%, 12 [4.2%]
- 60/40: -1.6%, 5.9%, 11.4%; 34%, 12 [4.1%]
- 40/60: -2.1%, 5.1%, 10.3%; 26%, 12 [4%]
- AAA 1: 1.4%, 6.2%, 10.7%; 27%, 5 [5.1%]
- AAA 2: 4.3%, 6.4%, 8.2%; 11%, 2 [6%]
- AAA 3: .3%, 7%, 11.3% ; 30%, 9 [4.8%]
| Stock/Bonds | Min 10yr CAGR | Median 10yr CAGR | Max 10yr CAGR | Drawdown Max | Drawdown Length (yrs) | 40-Year SWDR |
|---|---|---|---|---|---|---|
| 100/0 | -3.3% | 7.8% | 14.8% | 49% | 13 | 4.1% |
| 88/12 (Stocks/Cash) | -2.6% | 7.3% | 13.4% | 44% | 12 | 4.4% |
(*drawdown is defined as a portfolio’s peak-to-trough loss.)
(**Many people say they will use a 3-year cash “bucket” for safety)
Everything I’ve written above goes against everything I’ve thought about investing since my dad showed me a compound interest calculator when I was a freshmen in high school. Since then, I’ve looked to maximize long-term compounded growth by being very heavy in equities, and it has served me well, but I have basically been lucky. I didn’t get to choose my start dates. I’ve been using a traditional young-person accumulation portfolio, but we are in the ballpark of 5 years to FI, and all of this has me thinking I need to decide on a retirement asset allocation and move to that portfolio very soon.
Key takeaways:
- A 100% equity portfolio has a very wide time-to-FI window. To narrow the window and guard against working longer than you want to, diversify away from equities earlier than you think you should.
- Maximizing withdrawal rates requires thinking about asset allocation beyond a traditional stock/bond split, but that is a post for another day. Often times, asset allocations that achieve modest growth combined with low volatility are the best performing (defined as high safe withdrawal rate) portfolios during retirement.
- If you are saving 50%+ of your income, starting from day 1 with your withdrawal asset allocation does not seem to meaningfully lengthen your time-to-FI, and it many meaningfully shorten it (especially at today’s valuations).
- If you are saving less than 50% of your income, 10 years from FI is a decent time to start thinking about moving your portfolio to a withdrawal allocation. If you are within 5 years of FI, then it is definitely time to start moving towards a withdrawal asset allocation.
Further thoughts:
- Yes, I’ve read every part of the series about safe withdrawal rates at Early Retirement Now. The above deals with 40-year withdrawal rates, and that’s not long enough for some people. I get that, but one of ERN’s suggestions is to start with a conservative portfolio and add equities as you age for longevity. Everything said above keeps this possibility intact. I’m mainly suggesting we need to get to our retirement portfolios much sooner and at a much more conservative allocation than conventional FI-wisdom suggests.
- Datamining: just as you can datamine to find the portfolio that optimizes historical return, so you can datamine to find a portfolio that optimizes risk-adjusted return, and neither guarantees outperformance into the future. I want to work towards putting together an out-of-sample study using returns outside the post-1970 window for some alternative asset allocations.
- Are international stocks unnecessary? I have around 50% of my stock portfolio in international stocks, and now I’m rethinking this. A lot of the AAA portfolios listed above put together assets that are highly uncorrelated, which means keeping things domestic increases the negative correlation. For example, long-term US government bonds will be more negatively correlated with US equities over international equities. If the key to portfolio diversification is negative correlation, maybe international stocks are unnecessary.
- Monte Carlo analysis rather than historical analysis can help to verify some of the hunches discovered looking at historical data since 1970.
- Real estate suddenly looks much more appealing. A lot of the opportunities I have come across don’t have attractive cap rates compared to the 20+ year CAGR of stocks. But, now, I see the value in taking a lower CAGR rate in exchange for lower volatility.
- All of the above is for a buy-and-hold portfolio. There are trend-following strategies that seek to limit downside risk while maintaining much of the equity upside. You trade absolute return for lower volatility, which is exactly what I am looking for. These systems are now more appealing, but due to the fact that many of us will have significant assets in a taxable account, trend-following may not be a good option.
If you’ve made it this far, thanks for reading. I look forward to your constructive thoughts.
Edited to add: There are only eight 40-year time periods since 1970 (used for safe withdrawal rates), so the start date for all eight time periods includes the very odd 1970s, so there will be some skew towards portfolios that were the best during that time. Some of the projections about safe withdrawal rates use projected future return data (just like Big ERN does, I might add, so it’s not without precedent). However, there are 38 10-year rolling periods, which include the 1970s, the 80’s, the bull run of the 90’s, the dot-com crash and great recession in the 2000s. So, the drawdown and min, median, and max CAGRs are probably actually more helpful than the safe withdrawal rates.
Do You Have Thoughts?
Send me a Letter to the Editor via email.
I’ve decided I don’t want a comments section, but I do want feedback. The best Letters will be published on this site (with your consent, of course). I can publish anonymously or I can include your name and a backlink, whatever works for you.